What it is
A coastal flood is sea water standing on land that is normally dry. The Weather Service warns of it along the ocean coasts and the bays and sounds joined to them; along the Great Lakes the same event is a lakeshore flood.
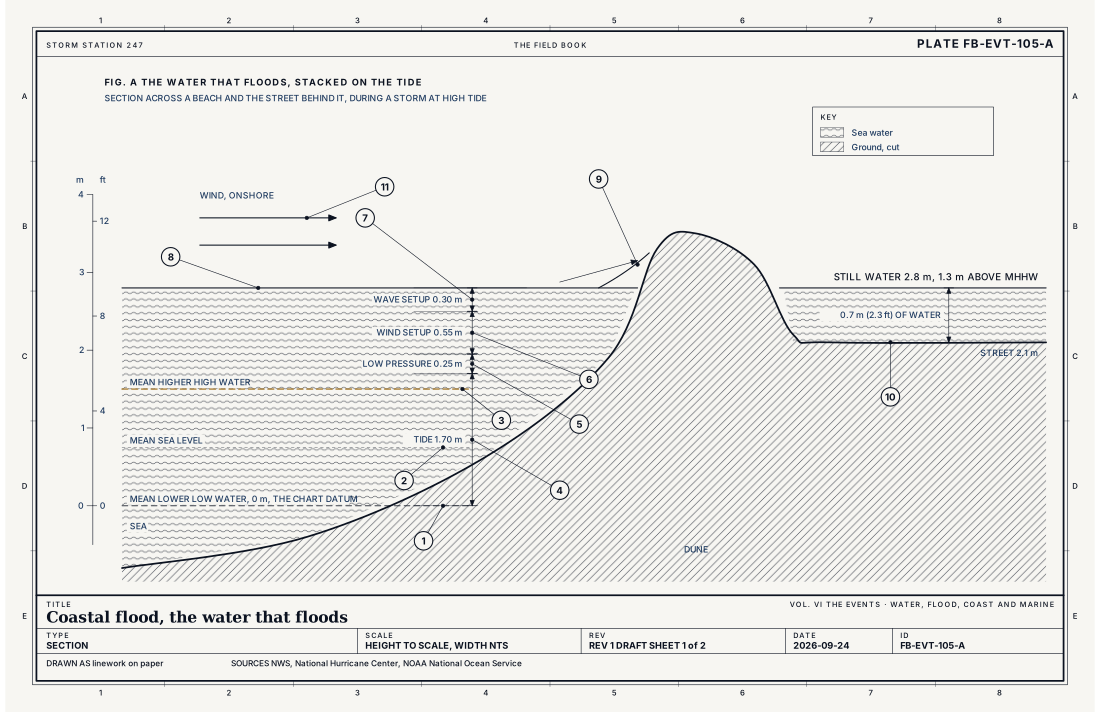
It is a sum. The tide sets the base: twice a day, near most of the coast, the sea rises and falls. A storm adds to it. Its wind pushes water toward the shore and piles it against the land. Its low pressure lets the sea surface rise beneath it. Its waves break and set the water up higher still at the shore, and run up the beach above that. When the sum rises above the land, the sea comes in.
Because the tide is part of the sum, a coastal flood keeps time with it. The water comes in at high tide, goes out at low tide, and comes back at the next high tide if the storm is still there. A storm that lasts three days can flood the same street five or six times.
What it is not
It is not the storm surge. The surge is the part the storm adds: the water level observed, less the tide predicted for that minute. The flood is the storm tide, the surge on top of the tide. A surge of 1 m (3.3 ft) at low tide may flood nothing; the same surge at a spring high tide may flood a city. Storm tide, storm surge and wave runup FB-EVT-112 draws the three terms apart.
It is not rain. Rain can flood a coastal city at the same time, and it makes the coastal flood worse when the drains that should carry it out are held shut by the sea, but it is a different flood with a different warning.
It is not a tsunami, which is made by the sea floor moving, not by the weather.
It is not always a storm. On a coast that sits close to the high tide line, a spring tide alone, or a perigean spring tide (the king tide, when the moon is also at its closest), can flood low streets on a sunny day. As sea level rises, those days are becoming more frequent.
Lookalikes
- Storm surge
- The part of the rise the storm adds. The surge is not the flood: the flood is the storm tide, the surge on top of the tide. That is Storm tide, storm surge and wave runup FB-EVT-112.
- Tsunami
- Waves made by the sea floor moving, not by the weather. It has its own warnings. That is Tsunami FB-EVT-117.
- Rip current
- A current flowing seaward through the surf. It drowns swimmers, and floods nothing. That is Rip current FB-EVT-108.
The machine
Fig. A stacks the terms on a section across a beach.
- The datum. Every height at the coast is measured from a tidal datum. Mean lower low water is the chart datum, the level ships' soundings count from. Mean higher high water, the average of each day's higher high tide, is the line flood thresholds count from.
- The astronomical tide. The moon and the sun raise the tide, and the ocean basins shape it. Near new and full moon, when the two pull in line, the range is largest: the spring tides. At the quarters it is smallest: the neaps. The tide can be predicted years ahead for any gauge, to the minute. The machine behind it is Moon and tides FB-CLK-003.
- The inverted barometer. Where the air pressure is low, the sea surface rises: about 1 cm for each hPa the pressure falls. A deep coastal low 30 hPa below its surroundings lifts the sea about 30 cm (1 ft). In a hurricane it is more.
- The wind setup. A steady wind blowing toward the shore drags on the sea surface and pushes water shoreward faster than it can return beneath. The water piles up until its slope balances the wind's push. The equation for that slope is below: the setup grows with the square of the wind speed and inversely with the depth, so a long, shallow shelf, like much of the Gulf and the mid Atlantic, sets up far more water than a deep one. In a nor'easter it is usually the largest term.
- The wave setup and the runup. Waves breaking in the surf zone push the mean water level up at the shore, by tenths of a metre in large surf. Each wave then runs up the beach above that. Runup erodes dunes and overtops them; once a dune is breached the still water flows through.
The flood itself is the still water level, the tide and the three storm terms together, standing above the land. Fig. B draws how that level moves through three days at one gauge: the tide rising and falling twice a day, the surge building and falling as the storm passes, and the flooding only at the high tides near the surge's peak.
Why the threshold is counted from the tide
A water level of 2 m means nothing by itself; the same level floods one harbour and is ordinary in the next. So every threshold is set against the local tide, above mean higher high water. NOAA's common thresholds put minor flooding about 0.5 m (1.6 ft) above it, moderate about 0.8 m (2.6 ft) and major about 1.2 m (3.9 ft), each a little higher where the tide range is large. The Weather Service offices set their own thresholds for many gauges, from what floods at each.
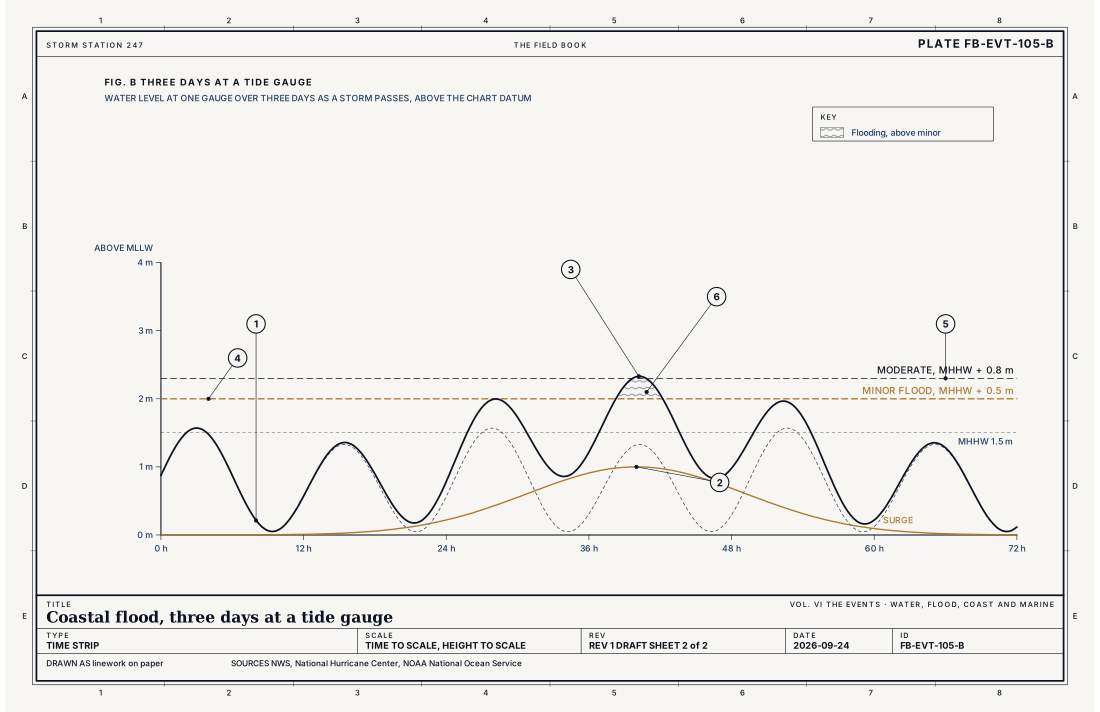
- The predicted tide
- The surge, observed less predicted
- The observed water level
- Minor flood threshold
- Moderate flood threshold
- Flooding, at high tide
Ingredients
- The tide: a spring tide near new or full moon, or a perigean spring tide, starts higher
- Wind blowing toward the shore for hours over a long fetch and a shallow shelf, which piles the water up
- Low pressure, which lets the sea surface rise under the storm
- Waves, which set the water up further at the shore and run up the beach
- Low land: a coast already near the high tide line, and sea level that is rising
Scales
- time
- hours, at each high tide, over one to several days
- horizontal
- tens to hundreds of kilometres of coast (tens to hundreds of miles)
- vertical
- a few tenths of a metre above the highest tides for minor flooding, to several metres in a hurricane's surge
- orlanski
- meso-alpha to synoptic
Equations
Wind setup over a shelf
- the rise of the sea surface above its level without wind, m
- distance toward the shore, m
- the wind's stress on the sea surface, N m⁻²
- the density of sea water (about 1,025 kg m⁻³) and of air (about 1.2 kg m⁻³)
- gravity, 9.81 m s⁻²
- the depth of the water, m
- the drag coefficient of the sea surface, about 0.001 to 0.003
- the wind speed at 10 m, m s⁻¹
Assumes A steady wind blowing straight onshore over a shelf of depth h, in one dimension, with the friction of the sea bed neglected. The setup is largest where the water is shallowest, which is why a wide, shallow shelf floods worst.
Working form The pressure part, the inverted barometer, is simpler: the sea rises about 1 cm for each hPa the pressure falls below its surroundings (about 0.4 in for each 0.03 inHg).
Signatures
- gauge
- the observed water level running above the predicted tide by the surge; and the gap growing through a day or more of onshore wind
- surface
- a long fetch of strong onshore wind at coastal stations; and falling pressure
- satellite
- a large cyclone offshore; its wind field turned toward the coast
- radar
- not the radar's to see; it sees the rain that may also be falling
The numbers
| Quantity | Value, and the kind of number it is |
|---|---|
| Storm tide | The water level during a storm: the storm surge added to the astronomical tideStandard, Storm Surge Overview |
| Inverted barometer | The sea rises about 1 cm for each 1 hPa fall in pressureTextbook, Pugh 2014 |
| Semidiurnal tide | Two highs and two lows a lunar day, 24 h 50 min; one cycle every 12 h 25 minTextbook, Pugh 2014 |
| Spring and neap | Spring tides, the largest range, come a day or two after new and full moon; neap tides after the quartersTextbook, Pugh 2014 |
| Minor flood threshold | About 0.5 m (1.6 ft) above mean higher high water, a little more where the tide range is largeStandard, Patterns and Projections of High Tide Flooding Along the U.S. Coastline Using a Common Impact Threshold |
| Moderate flood threshold | About 0.8 m (2.6 ft) above mean higher high waterStandard, Patterns and Projections of High Tide Flooding Along the U.S. Coastline Using a Common Impact Threshold |
| Major flood threshold | About 1.2 m (3.9 ft) above mean higher high waterStandard, Patterns and Projections of High Tide Flooding Along the U.S. Coastline Using a Common Impact Threshold |
| Tide gauge interval | A water level every 6 minutesStandard, Tidal Datums |
How the station sees it
The tide gauge is the instrument for this hazard. Each measures the water level every 6 minutes, and each has its own predicted tide. The difference between the two, observed less predicted, is the surge, and a forecaster watching a storm reads the flood from it: the surge now, plus the tide still to come at the next high water.
The weather stations on the coast in the instrument atlas see the storm's part: the strength and direction of the wind, and how long it has blown onshore, and the fall in pressure. A day of wind from the northeast at a mid Atlantic airport is how a nor'easter's coastal flood begins.
- Tide gauges: the water level itself, every 6 minutes, against the tide predicted for that minute
- Airport weather stations on the coast: the wind that drives the water, and the pressure
How it is warned
A Coastal Flood Watch is issued a day or more ahead when flooding is possible. A Coastal Flood Warning is issued when moderate or major flooding is expected, and a Coastal Flood Advisory for minor flooding, the kind that closes low roads and floods low lots. A Coastal Flood Statement covers lesser or follow up information. Each gives the times of the high tides when the water will be highest, and often the expected water level at a named gauge.
For a tropical storm or hurricane the surge is its own product: the Storm Surge Watch and Storm Surge Warning, issued for the danger of life threatening inundation, with the expected depth of water above the ground.
Salt water on a road hides the road as fresh water does, and it ruins what it reaches. Move vehicles to higher ground before the high tide, not during it.
| VTEC | Phenomenon | The alerts that carry it |
|---|---|---|
CF | coastal flood | Coastal Flood Advisory; Coastal Flood Statement; Coastal Flood Warning; Coastal Flood Watch |
Weather radio (SAME) codes: CFA CFW
See also
- Moon and tides FB-CLK-003
- Storm tide, storm surge and wave runup FB-EVT-112
- Storm surge FB-EVT-047
- Nor'easter FB-EVT-066
- Lakeshore flood FB-EVT-106
- Tide gauge FB-INS-008
- Tide as a water machine FB-WAT-042
- How to read a warning FB-STN-001
Sources
- National Weather Service. Directive 10-320, Surf Zone Forecast and Coastal/Lakeshore Hazard Services.
- National Hurricane Center. Storm Surge Overview.
- NOAA National Ocean Service. Tidal Datums.
- Sweet, W. V. and others, NOAA National Ocean Service. Patterns and Projections of High Tide Flooding Along the U.S. Coastline Using a Common Impact Threshold, NOAA Technical Report NOS CO-OPS 086 (2018).
- Pugh, D. and P. Woodworth. Sea-Level Science (2014).
- American Meteorological Society. Glossary of Meteorology.
Definition after the Directive 10-320, Surf Zone Forecast and Coastal/Lakeshore Hazard Services. Plate FB-EVT-105, revision 1, 2026-09-24. The number is permanent; cite it.